
Naturally Occurring Optical Filters
Optical micrographs acquired in transmission mode (Figures 4a and 5a) show that thin-film samples of both red and green ammolite appear nearly transparent to visible light.
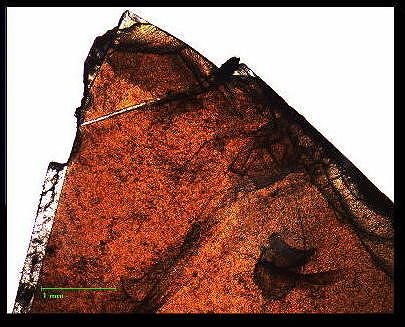
Figure 4a Transmission optical micrograph of a red ammolite sample. Note the yellowish tinge of the sample.
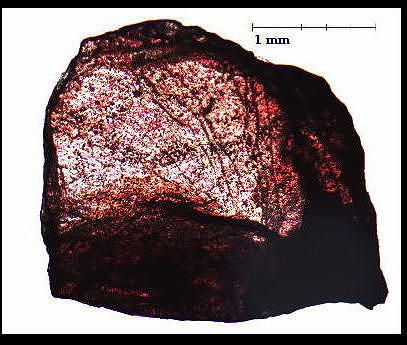
Figure 5a Transmission optical micrograph of green ammolite sample 1.
The near-normal reflection optical micrographs of the same samples are dramatically different and appear bright red (Figure 4b) and green (Figure 5b). This is because ammolite selectively reflects narrow bands of red (≈ 620 nm) and green (≈525 nm, 560 nm) light leading to its characteristic vibrant colours and iridescence.
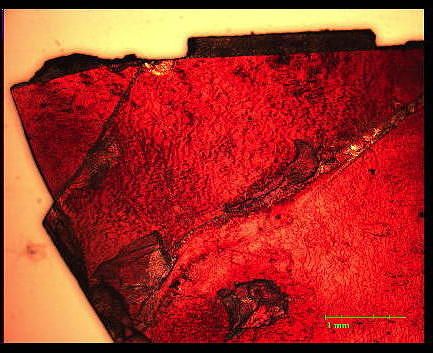
Figure 4b Reflection optical micrograph of a red ammolite sample.
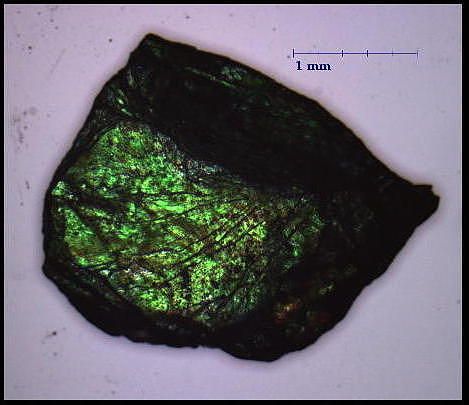
Figure 5b Reflection optical micrograph of green ammolite sample1.
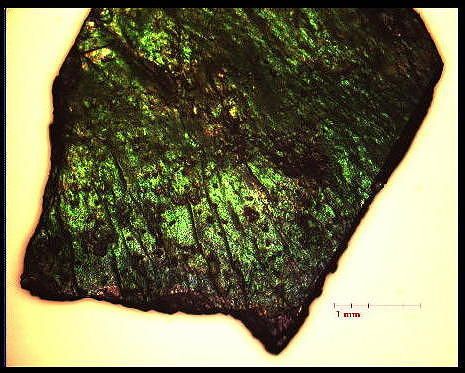
Figure 6a Reflection optical micrograph of green ammolite sample 2. As this sample is still attached to a layer of stone, transmission microscopy was not possible.
Reflection spectra of the three samples of ammolite in Figures 4b, 5b and 6a further demonstrate the selectivity of this material in reflecting and transmitting visible light. The full width at half height values of these spectra indicate that the samples reflect a very narrow band of wavelengths of the visible spectrum.
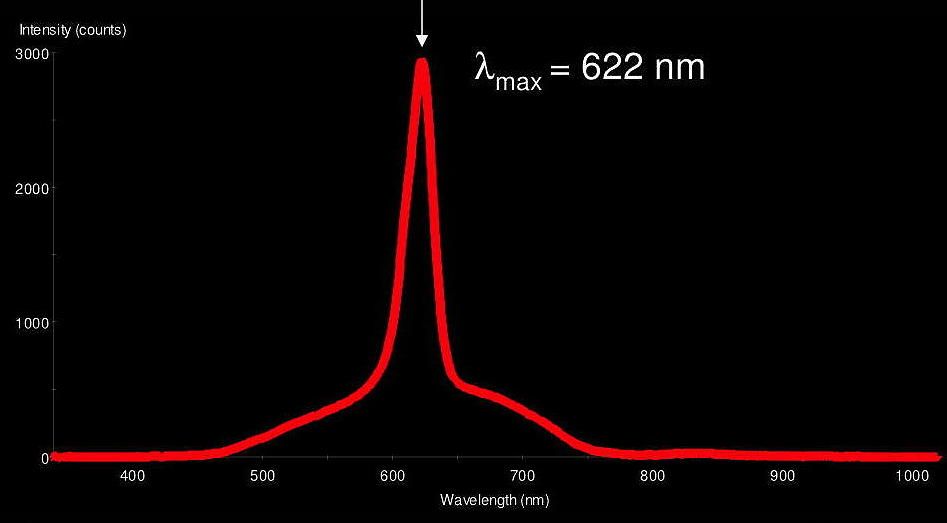
Figure 4c Reflection spectrum of red ammolite.
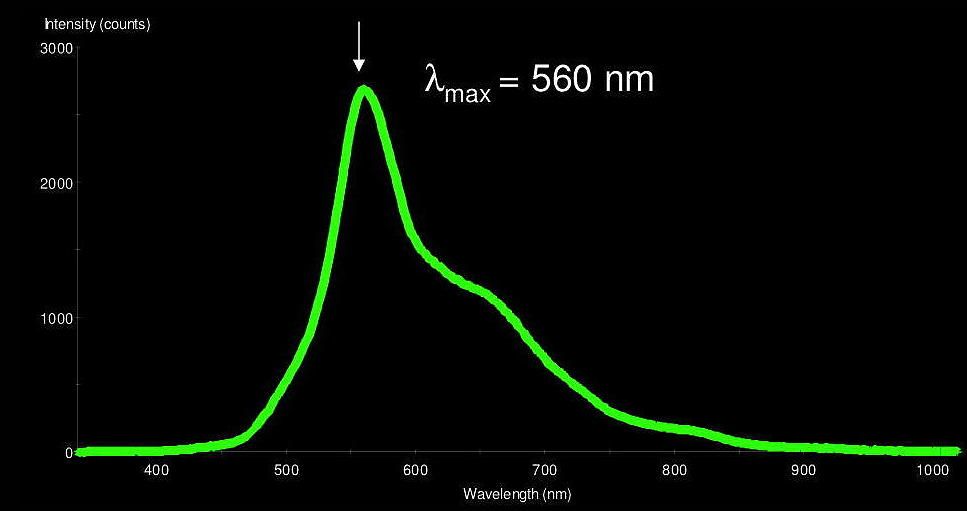
Figure 5c Reflection spectrum of green ammolite sample 1. The shoulder to apex is due to reflection of white light by the sample holder.
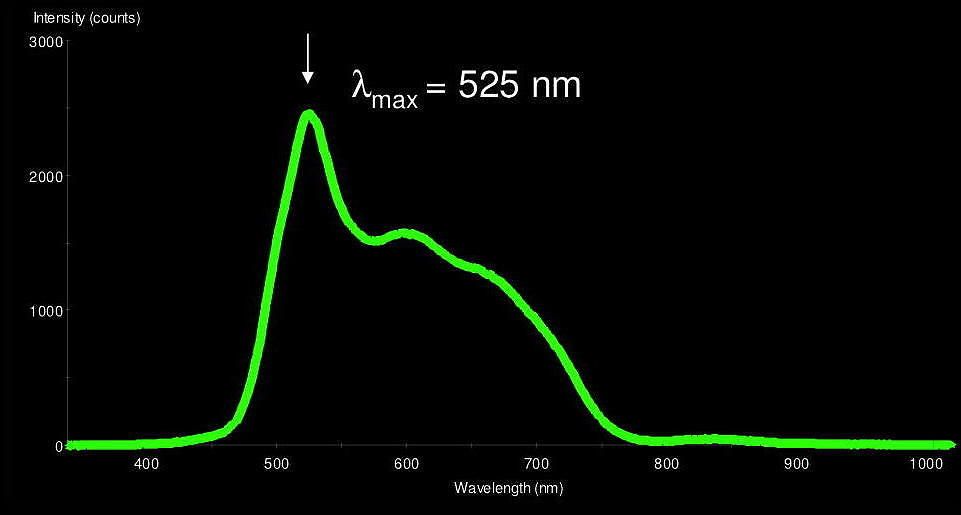
Figure 6b Reflection spectrum of green ammolite sample 2. The shoulder to apex is due to reflection of white light by the sample holder..
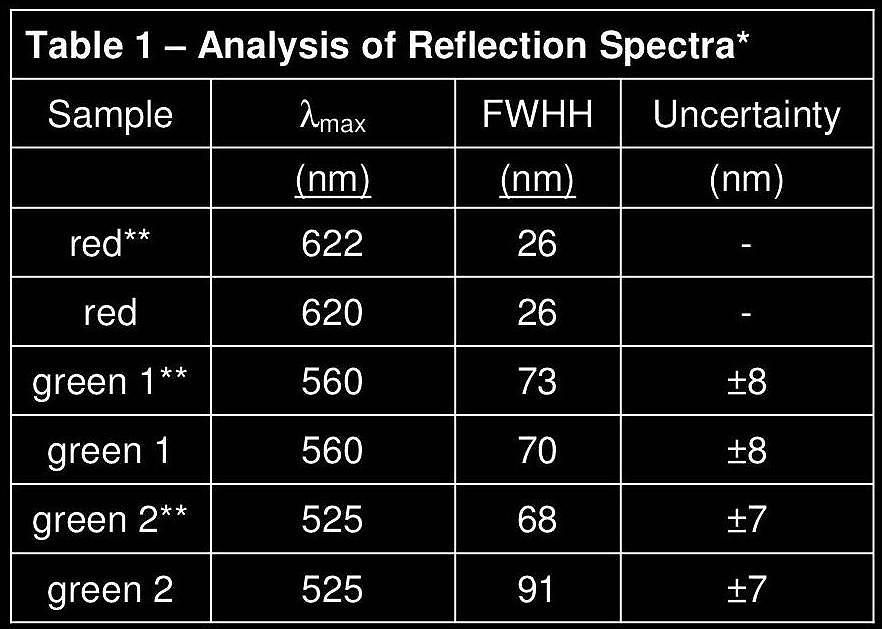
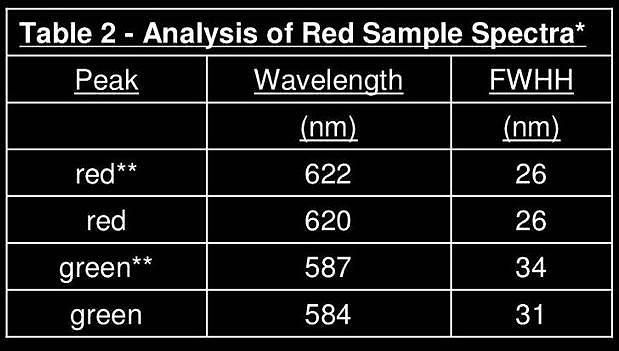
*Note: The spectra of the red sample were baseline corrected and the values in this chart calculated using Grams/AI.
**Note: The spectra shown in Figures 5c, 6c, and 7b correspond to these sets of data.
The Iridescence of Ammolite
The iridescence – or the change of colour with angle – of Ammolite is a striking property that is visible with the naked eye; green Ammolite sometimes appears blue when tilted, while red ammolite undergoes the change from red to green.
The reflection optical micrograph in Figure 8 shows a section of a green Ammolite sample that also shows its blue areas.
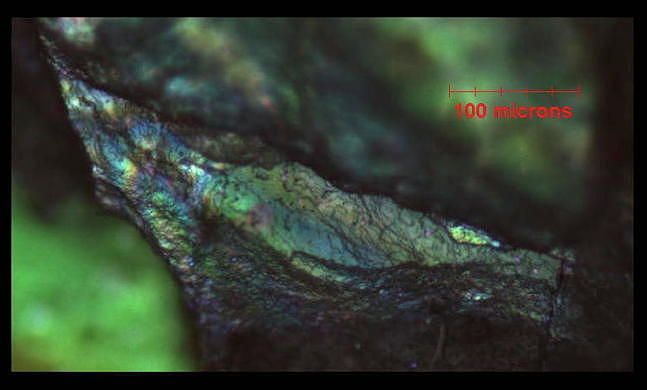
Figure 8 Reflection optical micrograph of green ammolite Sample 1 showing both green and blue colours.
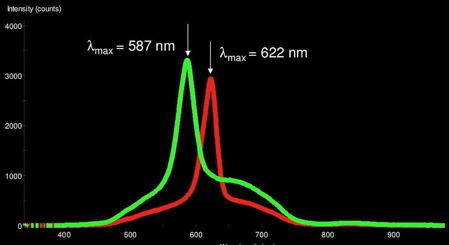
Figure 9 Reflection spectra of red ammolite at two different angles.
*Note: The spectra of the red sample were baseline corrected and the values in this chart calculated using Grams/AI.
**Note: The spectra shown in Figure 10 correspond to these sets of data.
Reflection spectra (Figure 9) show that when tilted from the near-normal position, the red ammolite sample in Figure 4b shifts its maximum wavelength of reflection from 622 (red) nm to 587 nm (green). This behaviour corresponds to the dramatic red to green colour-change observed by the human eye when the ammolite sample is tilted.
Both reflection spectra consist of discrete peaks with narrow bandwidths (Table 2) – comparable to state-of-the-art optical filters fabricated through precision lithographic techniques.